How to Export Colony Data to Excel
Export any list view in Moustra — Animals, Cages, Matings, and more — to a spreadsheet. Filter and choose your columns first; the export mirrors exactly what you see on screen.
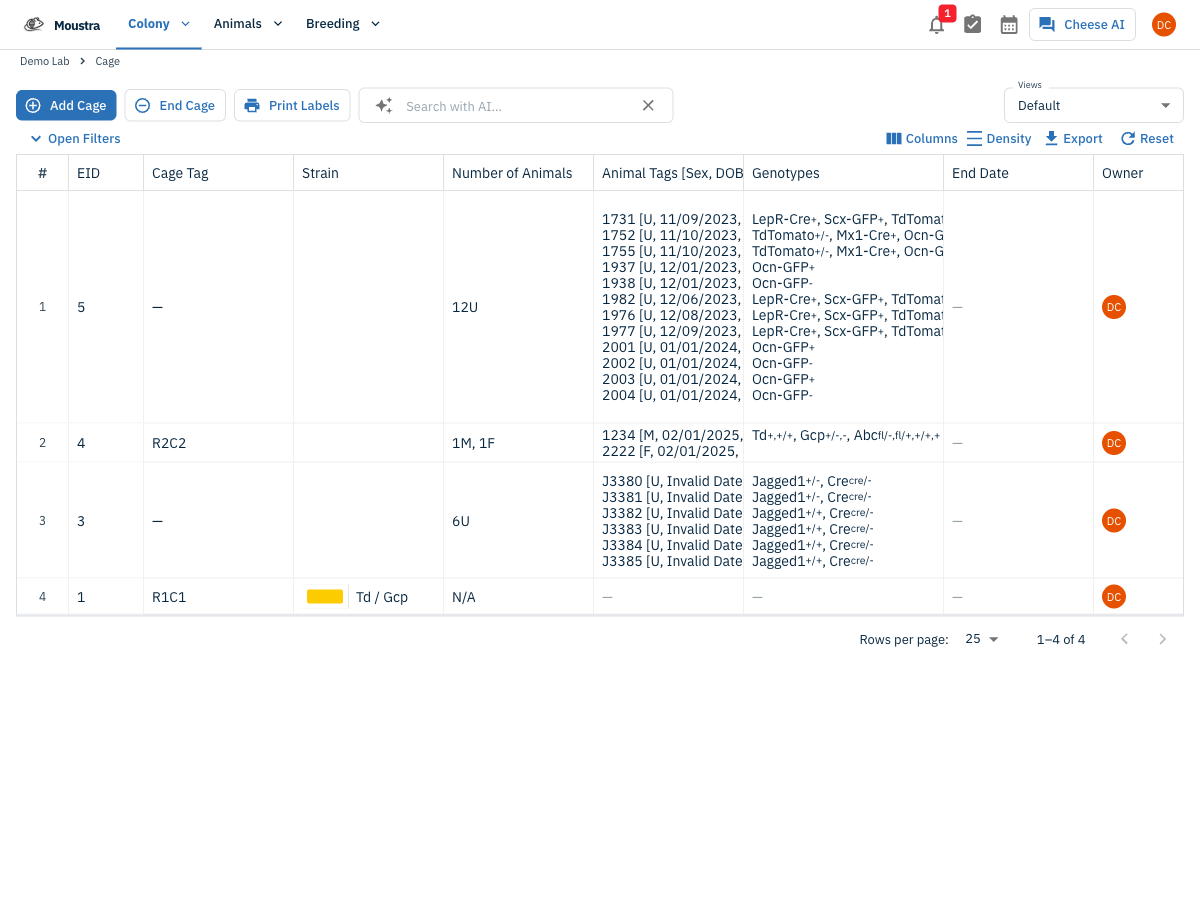
Open the list view you want to export
Open any grid — Animals, Cages, Matings, Litters, Plug Events, or any other list. Export lives in the toolbar of every list view; here we use Colony → Cages.
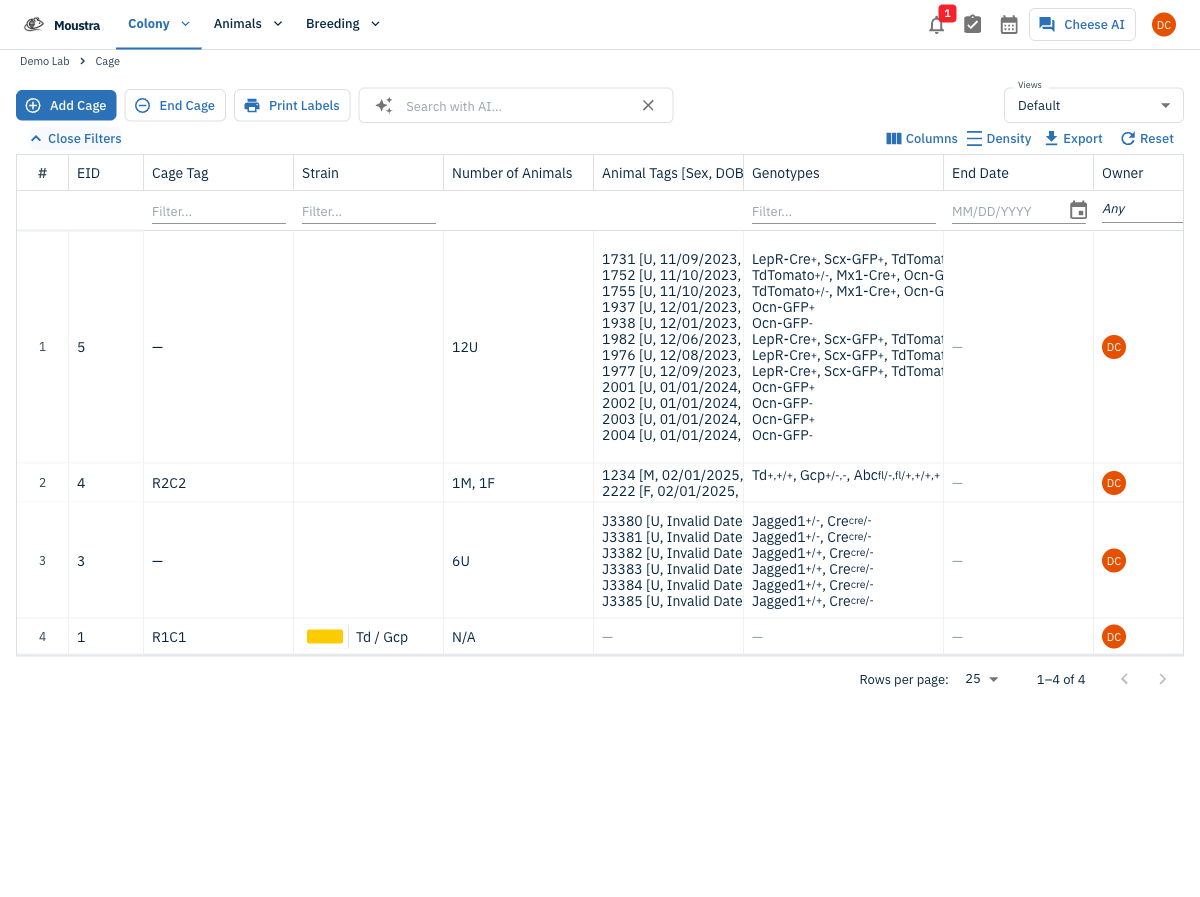
Filter to narrow your rows
Click Open Filters to reveal a filter under each column (text, date, or dropdown). The rows you leave showing are exactly the rows that get exported.
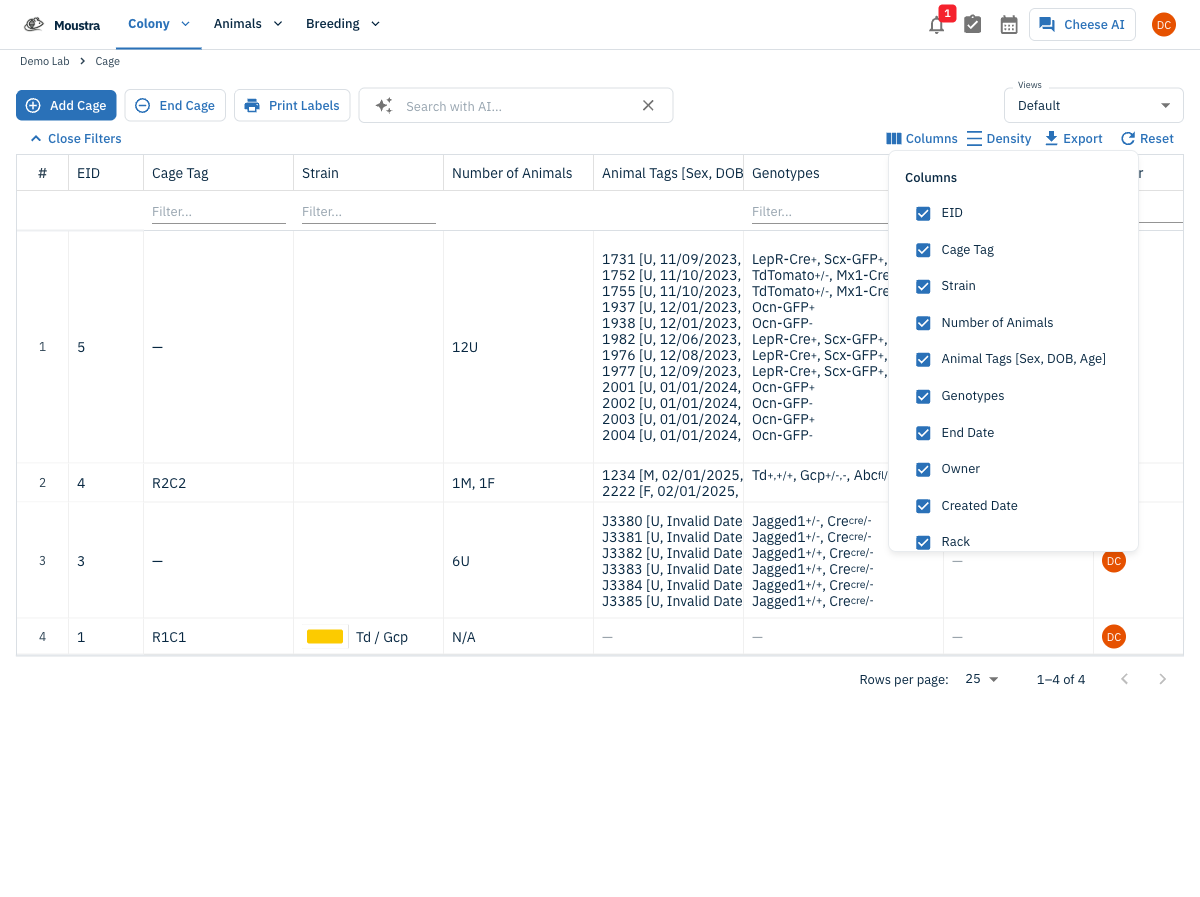
Choose which columns to include
Open the Columns menu and toggle field visibility. The export mirrors your visible columns, so hide what you don't need and show what you do.
Click Export
Click Export in the toolbar. Moustra generates an Excel spreadsheet (.xlsx) of the currently filtered rows and visible columns and downloads it to your browser.
Open and verify
Open the file in Excel, Numbers, or Google Sheets — you can re-save it as CSV there if you need that format — and confirm the row count matches the count shown at the bottom of the grid in Moustra.
More in Advanced
Quick Edit Cell
Edit values directly in any data grid: double-click an editable cell and Moustra shows the right input (text, number, date, or dropdown). Press Enter to save or Escape to cancel.
How to Print Cage Cards
Print cage labels with animal tags, strain, and IACUC information for physical cage identification.
How to Connect Slack
Receive real-time notifications in Slack for litters, weans, and colony milestones without logging into Moustra.