How to Set Up Study Groups, Treatments, and Timeline
Once a study has animals enrolled, you structure it from the tabs on the study detail page. This guide walks through creating a cohort in the Groups tab, assigning animals to it, adding a Treatment, scheduling a Time-point in the Timeline tab, and recording a Measurement — the building blocks for tracking a study over time.
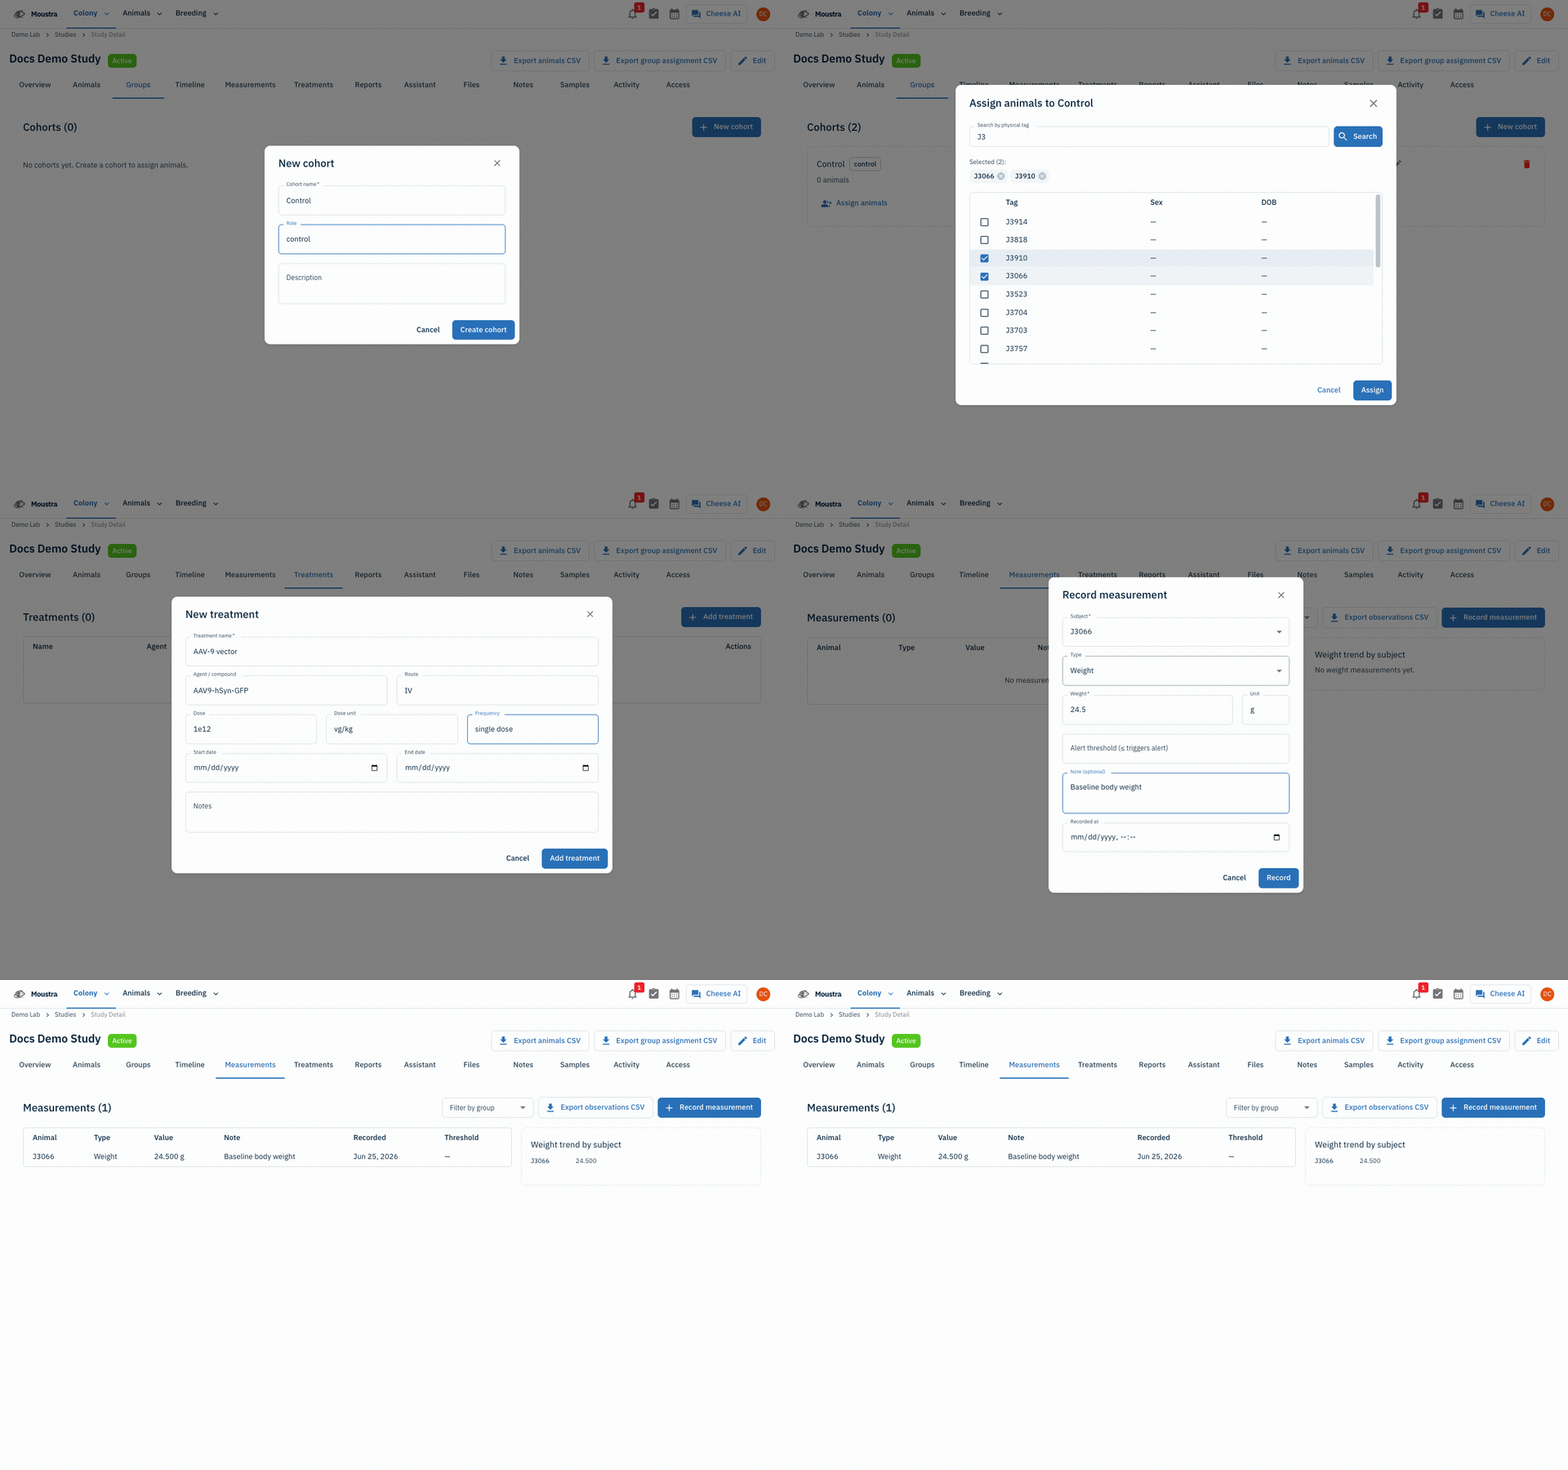
Create a cohort (Groups tab)
Open the study and select the Groups tab. The header shows Cohorts (n). Click New cohort and fill in Cohort name (required), an optional Role (e.g. control or treatment), and an optional Description, then click Create cohort. A new card appears in the Groups grid with the cohort name, its role chip, and an animal count.
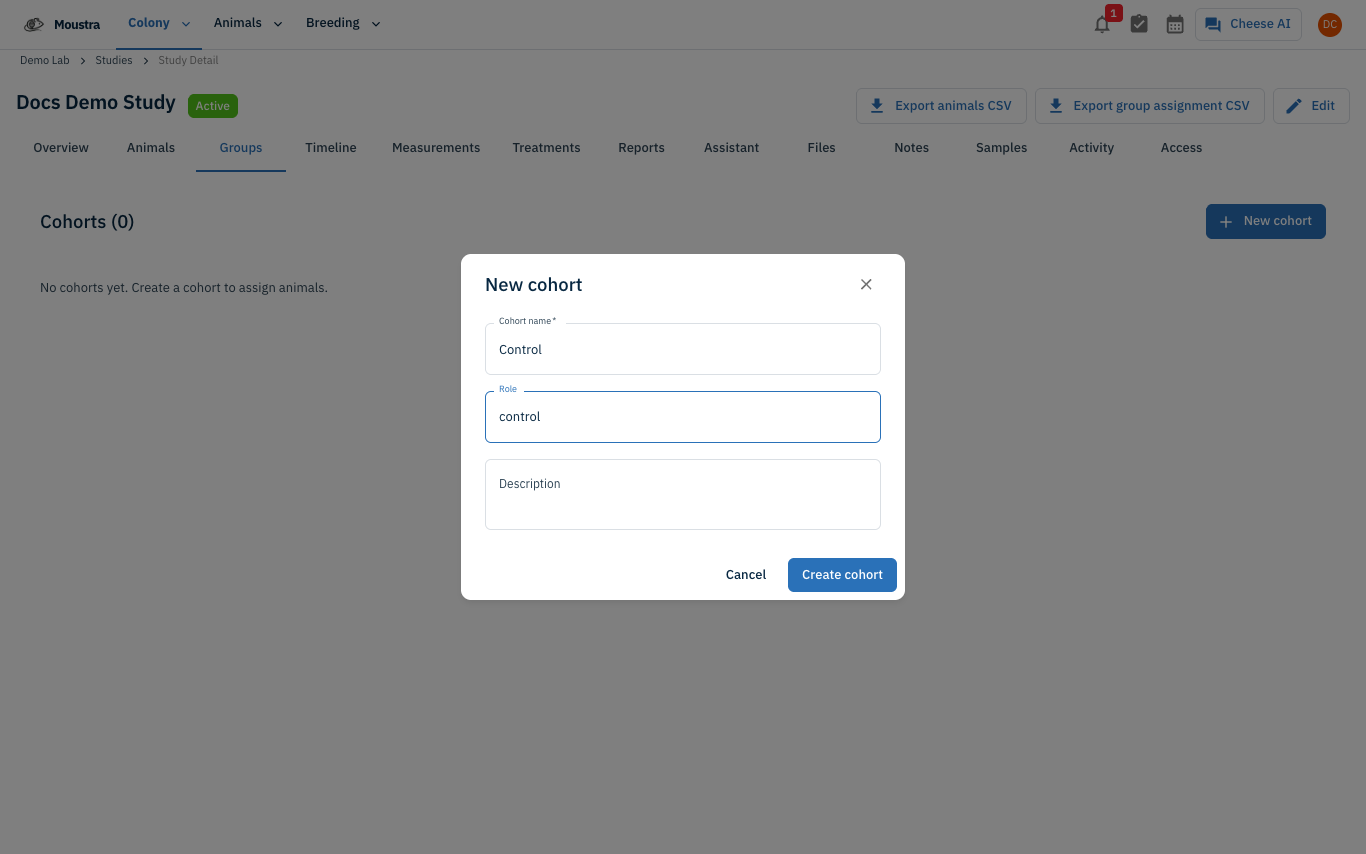
Assign animals to the cohort
On the cohort card, click Assign animals to open the Assign animals to [cohort] dialog. Type part of a tag in Search by physical tag and press Enter (or click Search). Matching animals appear with Tag, Sex, and DOB; click a row (or its checkbox) to select it — selected animals appear as removable chips under Selected (n). Click Assign to add them.
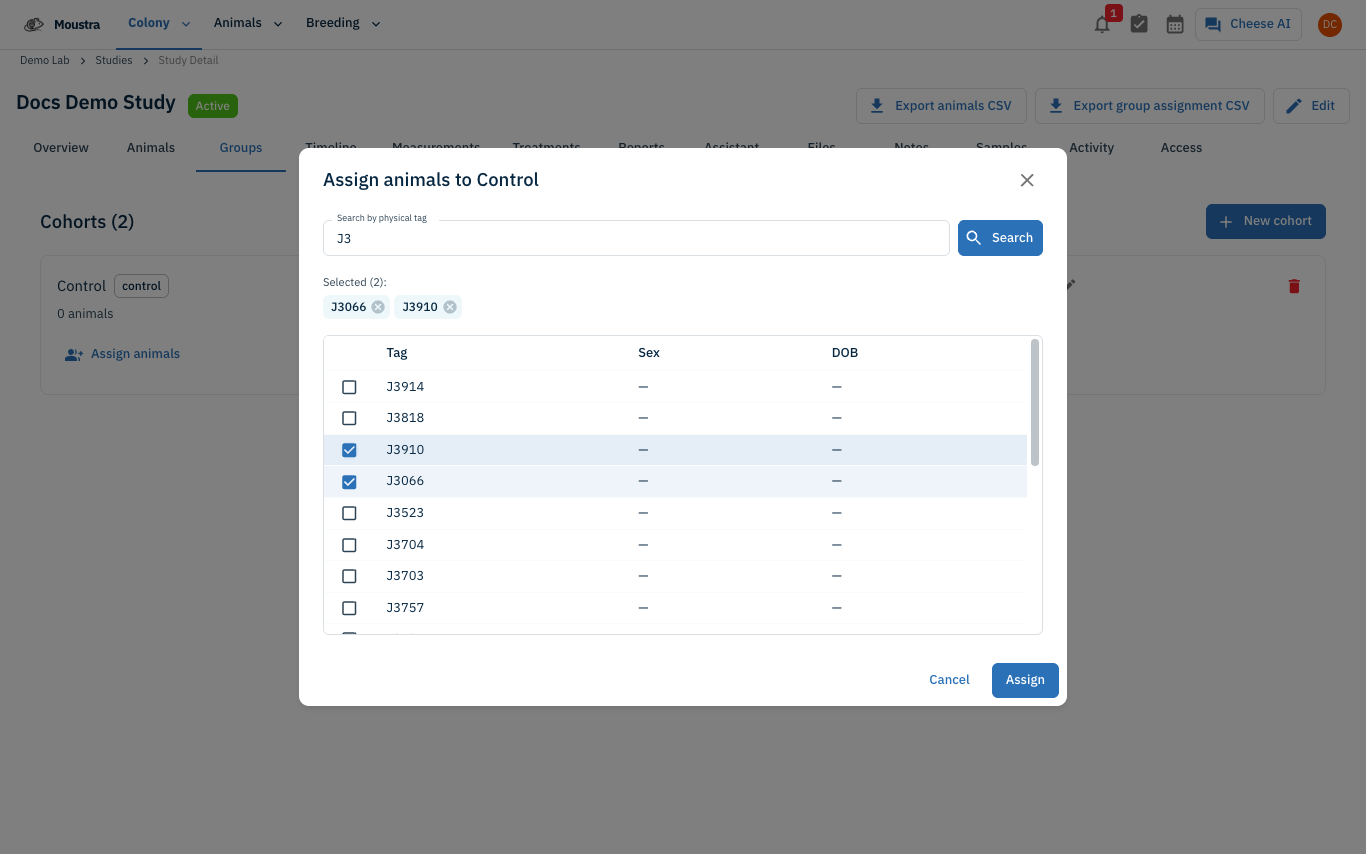
Add a treatment (Treatments tab)
Switch to the Treatments tab (header Treatments (n)) and click Add treatment. Record Treatment name (required) plus optional Agent / compound, Route (e.g. IP, PO, IV), Dose and Dose unit (e.g. mg/kg), Frequency, Start/End date, and Notes. Click Add treatment to save — it appears in the table with Name, Agent, Dose, Route, and Frequency.
Add a time-point (Timeline tab)
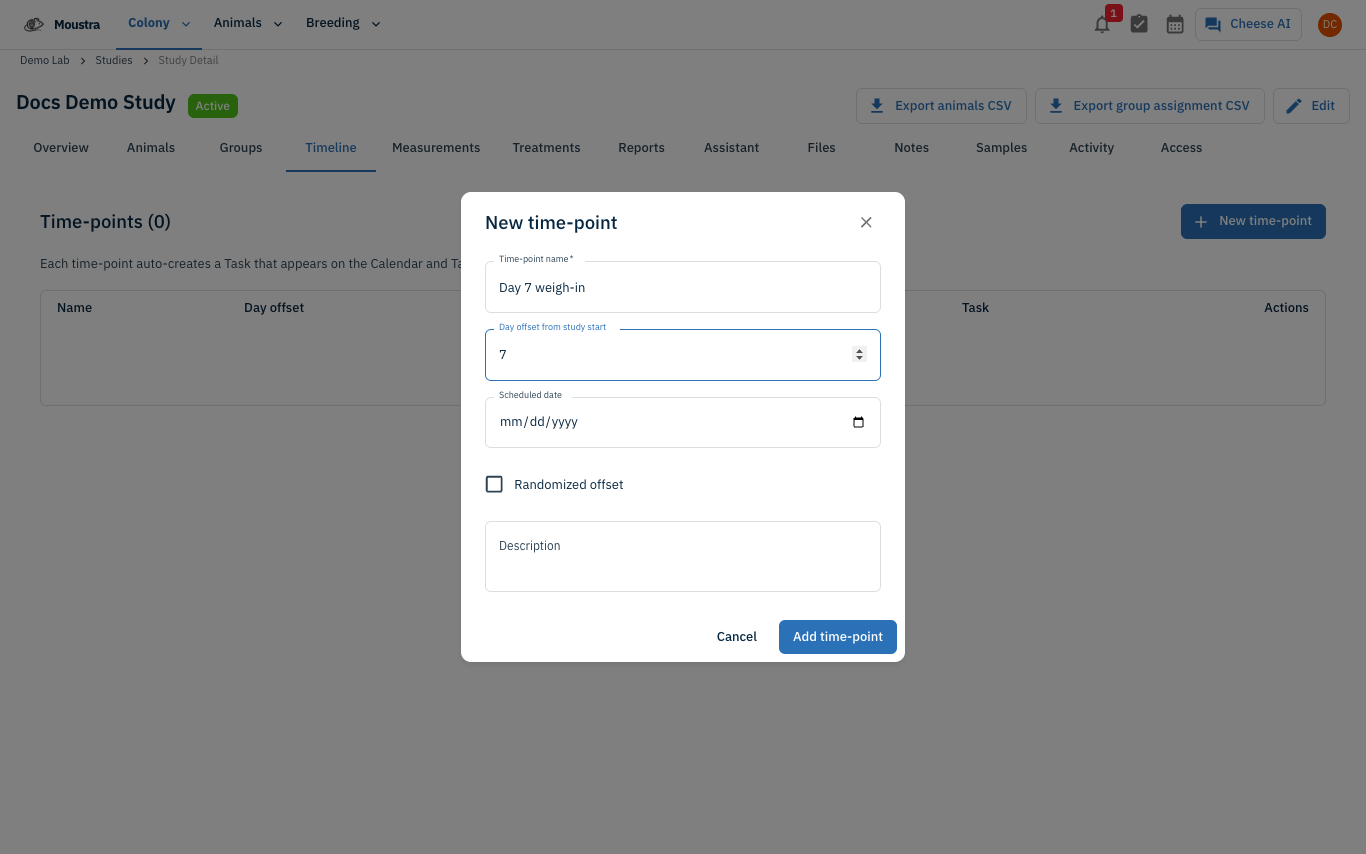
Open the Timeline tab (header Time-points (n)). A note explains: Each time-point auto-creates a Task that appears on the Calendar and Task dashboard. Click New time-point, give it a Time-point name (required), a Day offset from study start, an optional Scheduled date, an optional Randomized offset, and a Description, then click Add time-point. A row appears with Name, Day offset, Scheduled date, Status, and a View task link.
Record a measurement (Measurements tab)
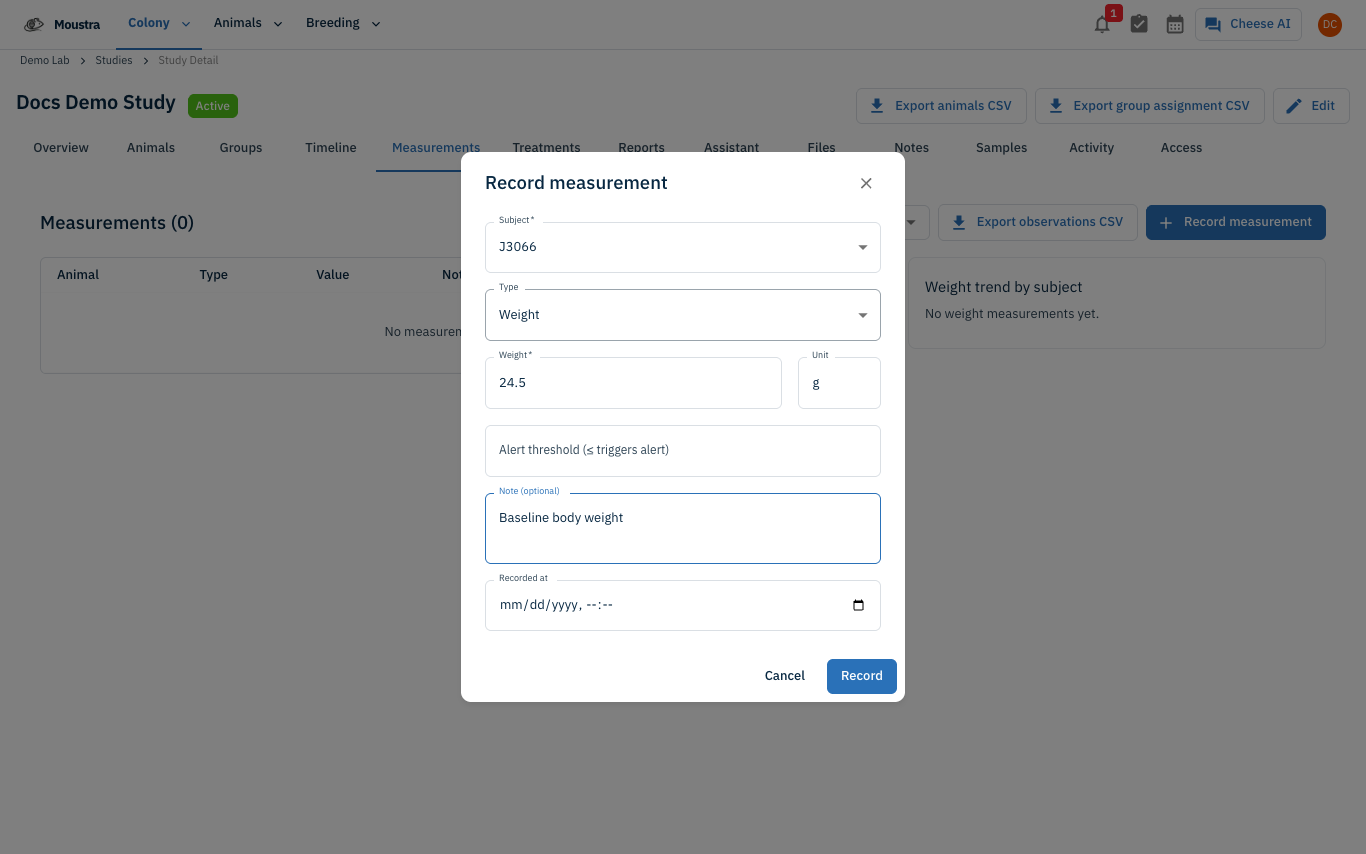
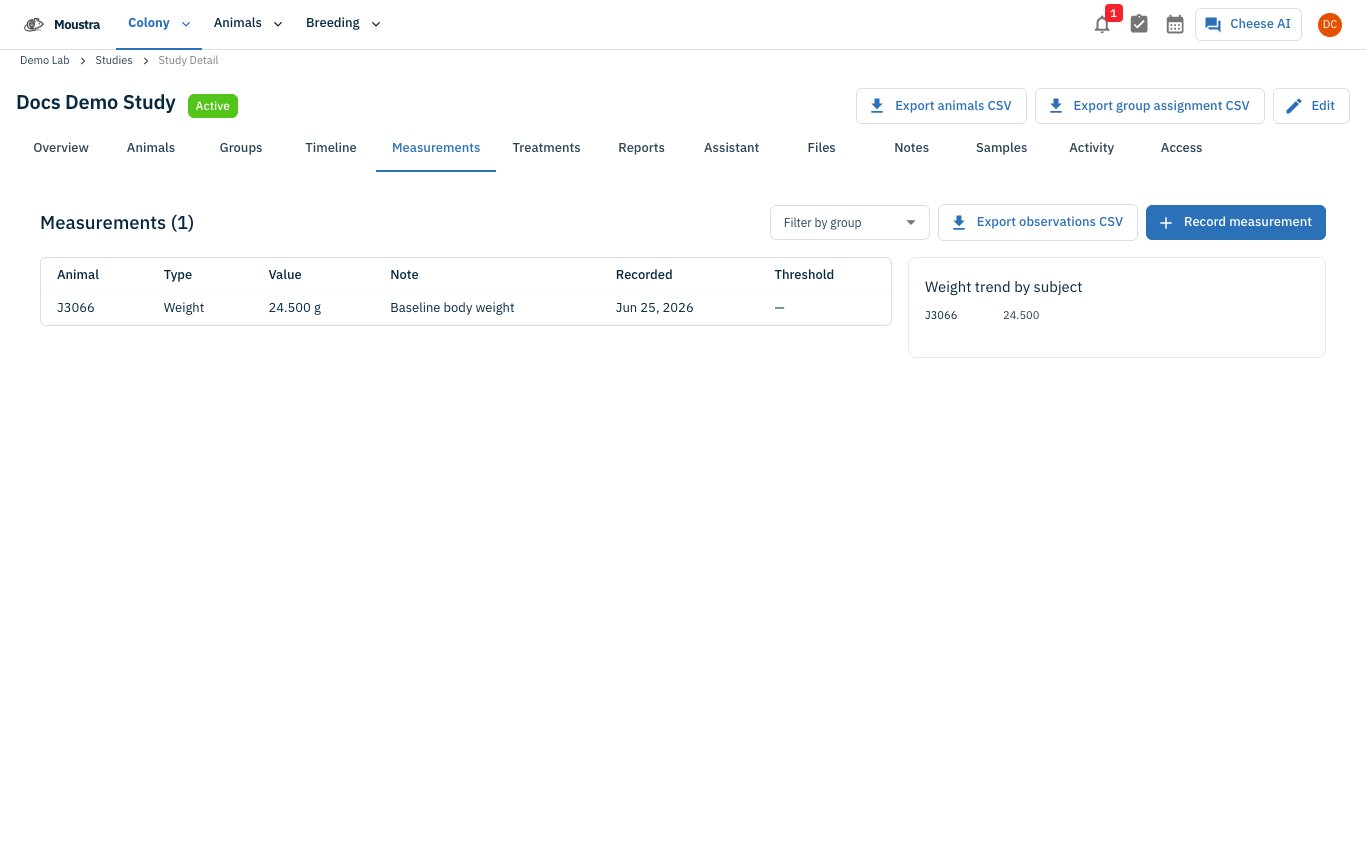
Open the Measurements tab and click Record measurement. Pick a Subject (required, an enrolled animal), a Type (Weight, Tumor size, Phenotype score, Treatment dose, Observation, or Clinical note), enter a value and Unit (a sensible default unit is filled in), and an optional Note and Recorded at date. For Weight an extra Alert threshold field appears. Click Record — it appears in the table and weight values feed the Weight trend by subject panel.
Export groups and observations to CSV
Two buttons in the study header — Export animals CSV and Export group assignment CSV — download the enrolled animals and their cohort assignments. On the Measurements tab, Export observations CSV downloads recorded measurements, and the Filter by group dropdown narrows both the on-screen table and the export to a single cohort.
More in Advanced
Quick Edit Cell
Edit values directly in any data grid: double-click an editable cell and Moustra shows the right input (text, number, date, or dropdown). Press Enter to save or Escape to cancel.
How to Print Cage Cards
Print cage labels with animal tags, strain, and IACUC information for physical cage identification.
How to Connect Slack
Receive real-time notifications in Slack for litters, weans, and colony milestones without logging into Moustra.